
Demystifying Debuggers, Part 3: Debugger-Kernel Interaction
On how kernels collect and expose information about program execution to debuggers.

As I stated in part 1, “debugger” wouldn’t have been my name choice for, well, debuggers, because it understates the full scope of their functionality. Debuggers are programs for interactive program runtime analysis. Now that I’ve unpacked what a program actually is, I can dig into what “analysis” means.
Debug Events
Debuggers execute as processes which receive information about another executing process, from an operating system’s kernel. In one way or another, a kernel will associate a debugger’s process with some other process. The debugger is said to be “attached” to this other process. This other process can be called the “debuggee” or “target” process.
When a debugger is attached to a process, it can receive information about notable events in that process’ execution, like:
When a process is created, and details about that process.
When a thread is created, and details about that thread.
When a module is loaded, and details about that module.
When a thread is named, which thread was named, and the contents of that name.
When a thread encounters an exception, like a “trap”, or memory violation, which thread encountered this exception, and at which instruction address this exception occurred.
When a thread logs a debug string, which thread logged it, and the contents of that string.
When a process exits.
When a thread exits.
When a module is unloaded.
These are called debug events.

The kernel is able to report these events to a debugger because these events are first reported to the kernel. This is either because: (a) these events are caused by a program’s direct interaction with the kernel, like its calling of LoadLibrary on Windows causing a module to be loaded, or (b) because the kernel configures the hardware to interrupt execution and report information to the kernel when certain events occur.
In the latter case, this is done through mechanisms like x86’s interrupt descriptor table, which encodes a table of code addresses—the beginning addresses of a number of “interrupt handlers”. The CPU—upon encountering specific error conditions (or “exceptions”—not to be confused with exceptions in high-level languages)—will execute code at one of these addresses. It selects an entry in the table using a numeric code, which represents whatever error condition was encountered.
This system is used to implement virtual address spaces, as I previously described.

When a virtual address fails to map to a physical address using a page table, a page fault is raised. On x86, the code for this fault happens to be 0x0E—this code is used to select a specific interrupt handler from the interrupt descriptor table. The CPU will jump execution to the associated interrupt handler, which is supplied by the kernel. Thus, the fact that the code accessed a non-physically-mapped address is first reported to the kernel.
In this case, one possibility is that the kernel swapped the physical storage for some address to disk, but the virtual address is completely legal for the program to access.

Another possibility is that the virtual address was not legal for the program to access. This is a situation in which this information would be reported to a debugger, if one is attached to the thread’s owner process. If a debugger is not attached, then the kernel has a number of other options—for example, it might simply kill the process, or it might want to launch a debugger and attach it to the process (a feature known as “Just-In-Time Debugging”), so that the state of the process can be inspected.
There are a number of design decisions a kernel might make in how it chooses to report this information to a debugger. For example, if one thread encounters an exception, do the process’ other threads continue executing? Or, if that thread is simply reporting a debug event which doesn’t necessarily halt execution—like a new module being loaded, or a debug string being logged—does that thread (and, still, the others in the process) continue executing?
The model used by Windows is to enable the debugger to interleave its logic with the debuggee process. Thus, when an event is reported to a debugger, all threads in the associated process will stop being scheduled, until the debugger has signaled to the kernel that the process should resume.
The model used by Linux is similar, in that the debugger (in Linux terminology, the “tracer”) can interleave its work with the debuggee (the “tracee”), although attachment happens at thread-granularity, rather than process-granularity.
While not literally the case, it’s as if the debuggee calls into the debugger, in order to understand how to proceed. The kernel facilitates this by interrupting the debuggee, transferring execution to the debugger, and then when the debugger says the word, execution is transferred back to the debuggee.
There is a further layer of minutiae to this problem, in that the kernel can also decide whether or not to allow a single debugger to be attached to multiple processes, rather than a single process. Windows does allow this, for example. And thus, extra design decisions apply. If one thread in one process reports a debug events, we know that process halts, but do the threads within other debuggee processes also halt?
While working on the RAD Debugger, I deduced from experimentation that Windows does not, in fact, automatically suspend other debuggee processes, when one debuggee reports a debug event. This is idiosyncratic with the behavior at thread granularity, which suspends all threads in a process, if one reports a debug event. For the RAD Debugger, I decided to implement the process-granularity suspension myself, such that threads across processes behaved identically to threads within processes. This simplifies the debugger design (and thus the user interface and experience), as well, because there is only a single state which determines whether or not debuggees are executing, rather than a per-process state. Other designs, however, are possible.
Debug Event APIs
Because the information provided to the debugger about the debuggee(s) is, in essence, a sequence of events, it’s natural to expose it through a blocking event loop API, as Windows does, through its WaitForDebugEvent and ContinueDebugEvent APIs:
for(DEBUG_EVENT evt = {0};
    WaitForDebugEvent(&evt, INFINITE);
    ContinueDebugEvent(evt.dwProcessId, evt.dwThreadId, DBG_CONTINUE))
{
  // process `evt`
}
Linux’s primary debugger API—ptrace— is more granular. It’s not built directly for this event-loop structure, and as I mentioned earlier, it is a thread-granularity API rather than a process-granularity API, but it can be used to implement the same concept. It’s also used for a number of other operations—like many other Linux APIs, it’s like a Swiss Army knife.
With the above Windows API usage, either the debugger’s event loop is executing, or the debuggee process is executing. They do not simultaneously execute.

Note that, in a full debugger, there are codepaths which should execute simultaneously with the debuggee—for example, that which repeatedly builds and renders a user interface, and allows visualization of previously-received debug events, or any information which can be collected while the debuggee executes. In practice, these codepaths are moved to separate threads:

But I’ll cover more about that in a later post.
Reading Non-Event Debuggee Information
While debug events help inform the debugger of changes to a debuggee across time, they do not contain the full set of information that a debugger needs to read about a debuggee.
A debugger may also need to read memory from arbitrary addresses within a debuggee’s address space. Remember that virtual address spaces exist per-process—in other words, a debuggee’s address space is not a debugger’s address space, so it isn’t as simple as reading from an arbitrary pointer.
Given our understanding of virtual address spaces, it would easily be doable for an operating system to map the same physical storage into different address spaces—in this case, being the debugger’s and debuggee’s address spaces.

In practice, this is a much heavier weight operation than necessary, as it requires a virtual address space allocation, whereas debugger’s often simply want to read sub-page-size regions of memory, at one moment in time (rather than holding a persistent mapping to a region of memory in a child process across stretches of time).
Windows provides the means to do this with its ReadProcessMemory function:
BOOL ReadProcessMemory(
  [in]  HANDLE  hProcess,
  [in]  LPCVOID lpBaseAddress,
  [out] LPVOID  lpBuffer,
  [in]  SIZE_T  nSize,
  [out] SIZE_T  *lpNumberOfBytesRead
);
We can notice that—confusingly—the lpBaseAddress parameter, which encodes the address within hProcess from which data should be copied into lpBuffer, is a pointer. But pointers only refer to addresses within the virtual address space of the process in which they’re used. So this pointer can never be dereferenced, actually—it is merely an address-sized package, for encoding a virtual address in hProcess. Super weird! But, aside from that, this is fairly straightforward.
Linux provides the same functionality through pread, although that API less-confusingly uses an integer offset.
A debugger may also need to read thread register values—on Windows, this is provided through, mainly, the GetThreadContext API, although the exact APIs and how they’re used vary by underlying architecture. On Linux, this is provided through the ptrace API also (remember how I said it’s like a Swiss Army knife?).
A Simple Debugger Event Loop
To concretize this information, let’s build a simple Windows debugger program which launches a single process, attaches to it, and logs information about debug events that it sees.
We can do this with the following APIs:
CreateProcessA— to launch a process, and automatically attach to it.WaitForDebugEvent— to sleep our debugger loop, until a debug event occurs.ContinueDebugEvent— to continue the attached debuggee after we’re done processing a debug event’s data, and to signify whether or not the debugger has handled an exception.
First, we can use CreateProcessA to launch a process—if we use the DEBUG_PROCESS flag in our argument for dwCreationFlags, Windows will automatically attach our process as the debugger for the process we create.
// sample_debugger.c

#include <windows.h>

int main(int argument_count, char **arguments)
{
  // launch process, attach
  char *cmd_line = arguments[1];
  STARTUPINFOA startup_info = {sizeof(startup_info)};
  PROCESS_INFORMATION process_info = {0};
  CreateProcessA(0, cmd_line, 0, 0, 0, DEBUG_PROCESS, 0, 0, &startup_info,
                 &process_info);
  // ...
  return 0;
}
Then, using WaitForDebugEvent and ContinueDebugEvent, we can build our debug event loop:
// loop for debug events
for(DEBUG_EVENT evt = {0};
    WaitForDebugEvent(&evt, INFINITE);
    ContinueDebugEvent(evt.dwProcessId, evt.dwThreadId, DBG_CONTINUE))
{
  // ...
}
Finally, if our debuggee process terminates, we’ll want to exit our loop early, before calling ContinueDebugEvent:
// loop for debug events
for(DEBUG_EVENT evt = {0};
    WaitForDebugEvent(&evt, INFINITE);
    ContinueDebugEvent(evt.dwProcessId, evt.dwThreadId, DBG_CONTINUE))
{
  // ...
  if(evt.dwDebugEventCode == EXIT_PROCESS_DEBUG_EVENT)
  {
    break;
  }
}
Next, all we need to do is dig into the structure of DEBUG_EVENT, log some information for each DEBUG_EVENT our loop iterates over, and hook this up to an actual program.
Let’s begin by getting everything up and running. First, I’ll just stub out the logging code:
for(DEBUG_EVENT evt = {0};
    WaitForDebugEvent(&evt, INFINITE);
    ContinueDebugEvent(evt.dwProcessId, evt.dwThreadId, DBG_CONTINUE))
{
  printf("Received a DEBUG_EVENT\n");
  fflush(stdout);
  if(evt.dwDebugEventCode == EXIT_PROCESS_DEBUG_EVENT)
  {
    break;
  }
}
And I’ll hook it up to a trivial program:
// sample_debuggee.c

#include <windows.h>

int main(int argument_count, char **arguments)
{
  OutputDebugStringA("Hello, Debugger!\n");
  return 0;
}
Both of these programs can be built with MSVC, with the following commands:
cl /nologo /Zi sample_debugger.c
cl /nologo /Zi sample_debuggee.c
I can then run sample_debugger.exe, parameterizing it with the sample debuggee program:
sample_debugger.exe sample_debuggee.exeAnd the output is the following:
Received a DEBUG_EVENT
Received a DEBUG_EVENT
Received a DEBUG_EVENT
Received a DEBUG_EVENT
Received a DEBUG_EVENT
Received a DEBUG_EVENT
Received a DEBUG_EVENT
Received a DEBUG_EVENT
Received a DEBUG_EVENT
Received a DEBUG_EVENT
Received a DEBUG_EVENT
Received a DEBUG_EVENT
Not very useful! But now we can fill in the details by reading through the documentation for DEBUG_EVENT. I won’t exhaustively do so for the purposes of this post, but let’s fill in some basics. First, let’s log a string encoding which dwDebugEventCode each event contains:
// kind code -> name
char *evt_kind_name = "[unknown event kind]";
switch(evt.dwDebugEventCode)
{
  default:{}break;
  case CREATE_PROCESS_DEBUG_EVENT:{evt_kind_name = "CREATE_PROCESS";}break;
  case EXIT_PROCESS_DEBUG_EVENT:  {evt_kind_name = "EXIT_PROCESS";}break;
  case CREATE_THREAD_DEBUG_EVENT: {evt_kind_name = "CREATE_THREAD";}break;
  case EXIT_THREAD_DEBUG_EVENT:   {evt_kind_name = "EXIT_THREAD";}break;
  case LOAD_DLL_DEBUG_EVENT:      {evt_kind_name = "LOAD_DLL";}break;
  case UNLOAD_DLL_DEBUG_EVENT:    {evt_kind_name = "UNLOAD_DLL";}break;
  case EXCEPTION_DEBUG_EVENT:     {evt_kind_name = "EXCEPTION";}break;
  case OUTPUT_DEBUG_STRING_EVENT: {evt_kind_name = "OUTPUT_DEBUG_STRING";}break;
}

// log
printf("Received a %s DEBUG_EVENT\n", evt_kind_name);
fflush(stdout);
If we run this, we’ll see the following:
Received a CREATE_PROCESS DEBUG_EVENT
Received a LOAD_DLL DEBUG_EVENT
Received a LOAD_DLL DEBUG_EVENT
Received a LOAD_DLL DEBUG_EVENT
Received a EXCEPTION DEBUG_EVENT
Received a OUTPUT_DEBUG_STRING DEBUG_EVENT
Received a LOAD_DLL DEBUG_EVENT
Received a LOAD_DLL DEBUG_EVENT
Received a CREATE_THREAD DEBUG_EVENT
Received a LOAD_DLL DEBUG_EVENT
Received a EXIT_THREAD DEBUG_EVENT
Received a EXIT_PROCESS DEBUG_EVENT
Many of these are self-explanatory—the initial CREATE_PROCESS, the EXIT_PROCESS, and surely that OUTPUT_DEBUG_STRING corresponds with our sample debuggee’s call to OutputDebugStringA. But let’s clear up some perhaps confusing details (to the degree that we can). My knowledge is limited, since not all of this behavior is documented (or the documentation hasn’t been easy for me to find), so some of my answers will be unsatisfying, but I’ll do my best.
What is that EXCEPTION event?
This is a mystery to me, but I can conject. Through experimentation, it seems that—no matter what—Windows generates this exception after a process is launched, seemingly always after all initial modules (those required by the executable’s imports) are loaded. If I had to guess, this is to mark the end of the loader’s work—to signify to debuggers that no further modules will be loaded before the program’s actual code is executed. I’m not sure if this is the true explanation, but marking this exception as processed (by passing DBG_CONTINUE to ContinueDebugEvent) reliably works.
How is the only CREATE_THREAD event seen after our OUTPUT_DEBUG_STRING event, which was caused by the main thread?
This is due to some unfortunate idiosyncrasies and asymmetries in the Windows debug event API. Almost all threads generate CREATE_THREAD events, and almost all modules generate LOAD_DLL events—except the main thread and main module. These—the creation of the main thread and the loading of the main module—are implied by the CREATE_PROCESS event. So, before the OUTPUT_DEBUG_STRING event is encountered by the debugger event loop, the main thread was actually created.
This API choice unnecessarily bifurcates codepaths which must apply to all modules, or to all threads. This is why, in the RAD Debugger codebase, we designed our own event structure, which we produce by converting the event information within DEBUG_EVENTs—with this small extra conversion cost, we can simulate extra module-load or thread-creation events, given a CREATE_PROCESS event, such that all threads and all modules are represented by their own events. Thus, all per-module and all per-thread code can be trivially unified.
If that CREATE_THREAD event has nothing to do with the main thread, why is a thread created, then exited, before the program exits?
This seems to have something to do with the C runtime implementation. If we adjust our program to control its own low level entry point, and to remove its dependency on the C runtime, then our debug event log becomes much simpler.
Adjusting our debuggee program to this:
void WinMainCRTStartup(void){}Results in our debug event log being:
Received a CREATE_PROCESS DEBUG_EVENT
Received a LOAD_DLL DEBUG_EVENT
Received a LOAD_DLL DEBUG_EVENT
Received a LOAD_DLL DEBUG_EVENT
Received a EXCEPTION DEBUG_EVENT
Received a EXIT_PROCESS DEBUG_EVENT
Which cleans up three of the DLLs, and that strange thread spawned when our debuggee is about to exit. Thus, we can deduce that the thread—for one reason or another—is introduced to do something for the MSVC C runtime implementation.
Which DLLs are being loaded?
To do this, let’s continue inspecting the definition of DEBUG_EVENT. The documentation for LOAD_DLL_DEBUG_EVENT informs us that, if a DEBUG_EVENT’s dwDebugEventCode member matches LOAD_DLL_DEBUG_EVENT, then the union within DEBUG_EVENT is to be interpreted as a LOAD_DLL_DEBUG_INFO structure. That structure contains an hFile member, which is a HANDLE to the executable image file. We can use Windows’ GetFinalPathNameByHandleA API to produce the executable image’s full path. If we log that, we’ll know which DLLs are being loaded.
// extract module path
char module_path_buffer[256] = {0};
char *module_path = 0;
if(evt.dwDebugEventCode == LOAD_DLL_DEBUG_EVENT)
{
  GetFinalPathNameByHandleA(evt.u.LoadDll.hFile, module_path_buffer, sizeof(module_path_buffer), 0);
  module_path = module_path_buffer;
}

// log
printf("Received a %s DEBUG_EVENT", evt_kind_name);
if(module_path) { printf(" (%s)", module_path); }
printf("\n");
fflush(stdout);
This produces:
Received a CREATE_PROCESS DEBUG_EVENT
Received a LOAD_DLL DEBUG_EVENT (\\?\C:\Windows\System32\ntdll.dll)
Received a LOAD_DLL DEBUG_EVENT (\\?\C:\Windows\System32\kernel32.dll)
Received a LOAD_DLL DEBUG_EVENT (\\?\C:\Windows\System32\KernelBase.dll)
Received a EXCEPTION DEBUG_EVENT
Received a EXIT_PROCESS DEBUG_EVENT
Recall that, in part 2, I covered the sort of work that an operating system’s loader might do, when loading modules:

Every LOAD_DLL event also encodes at which address a module is loaded. We can log that too:
// extract base address
U64 base_vaddr = 0;
if(evt.dwDebugEventCode == LOAD_DLL_DEBUG_EVENT)
{
  base_vaddr = (U64)evt.u.LoadDll.lpBaseOfDll;
}

// log
printf("Received a %s DEBUG_EVENT", evt_kind_name);
if(module_path) { printf(" (%s)", module_path); }
if(base_vaddr)  { printf(" (0x%I64x)", base_vaddr); }
printf("\n");
fflush(stdout);
Received a CREATE_PROCESS DEBUG_EVENT
Received a LOAD_DLL DEBUG_EVENT (\\?\C:\Windows\System32\ntdll.dll) (0x7ffff2af0000)
Received a LOAD_DLL DEBUG_EVENT (\\?\C:\Windows\System32\kernel32.dll) (0x7ffff1970000)
Received a LOAD_DLL DEBUG_EVENT (\\?\C:\Windows\System32\KernelBase.dll) (0x7ffff0520000)
Received a EXCEPTION DEBUG_EVENT
Received a EXIT_PROCESS DEBUG_EVENTI recommend studying the documentation of DEBUG_EVENT, to see what further information it contains, and how it might be used. For instance, with this basic structure and very few extensions, we can start answering questions like:
My program crashed while using a pointer—was it reading from, or writing to that pointer? What was the pointer’s value?
A thread hit a trap instruction—at what address was that trap instruction?
What name has the program assigned to each of the created threads?
The next step in building useful debugger functionality lies in accumulating and using information from a history of received debug events. A debugger can treat debug events as deltas to apply to its own data structure, which mirrors a debuggee’s process structure. This way, a debugger can keep track of handles, names, or addresses for every thread and module.
Such a data structure comes in handy—for example, in implementing features like:
Given an address referenced by an
EXCEPTIONdebug event, and a history ofLOAD_DLLevents, determine which module that exception occurred within, and correlate it with its name.Use
ReadProcessMemoryto parse information out of a loaded executable image—since we know its address in the debuggee’s address space—like the path to its debug information file.Given a thread, read the value of its instruction pointer register, and determine from which module it’s executing code.
Debugger-to-Debuggee Interaction
Debug events are used to send information, debuggee-to-debugger. But I opened this post by stating that debuggers are for interactive runtime analysis. And true interactivity requires both debuggee-to-debugger, and debugger-to-debuggee information flow.
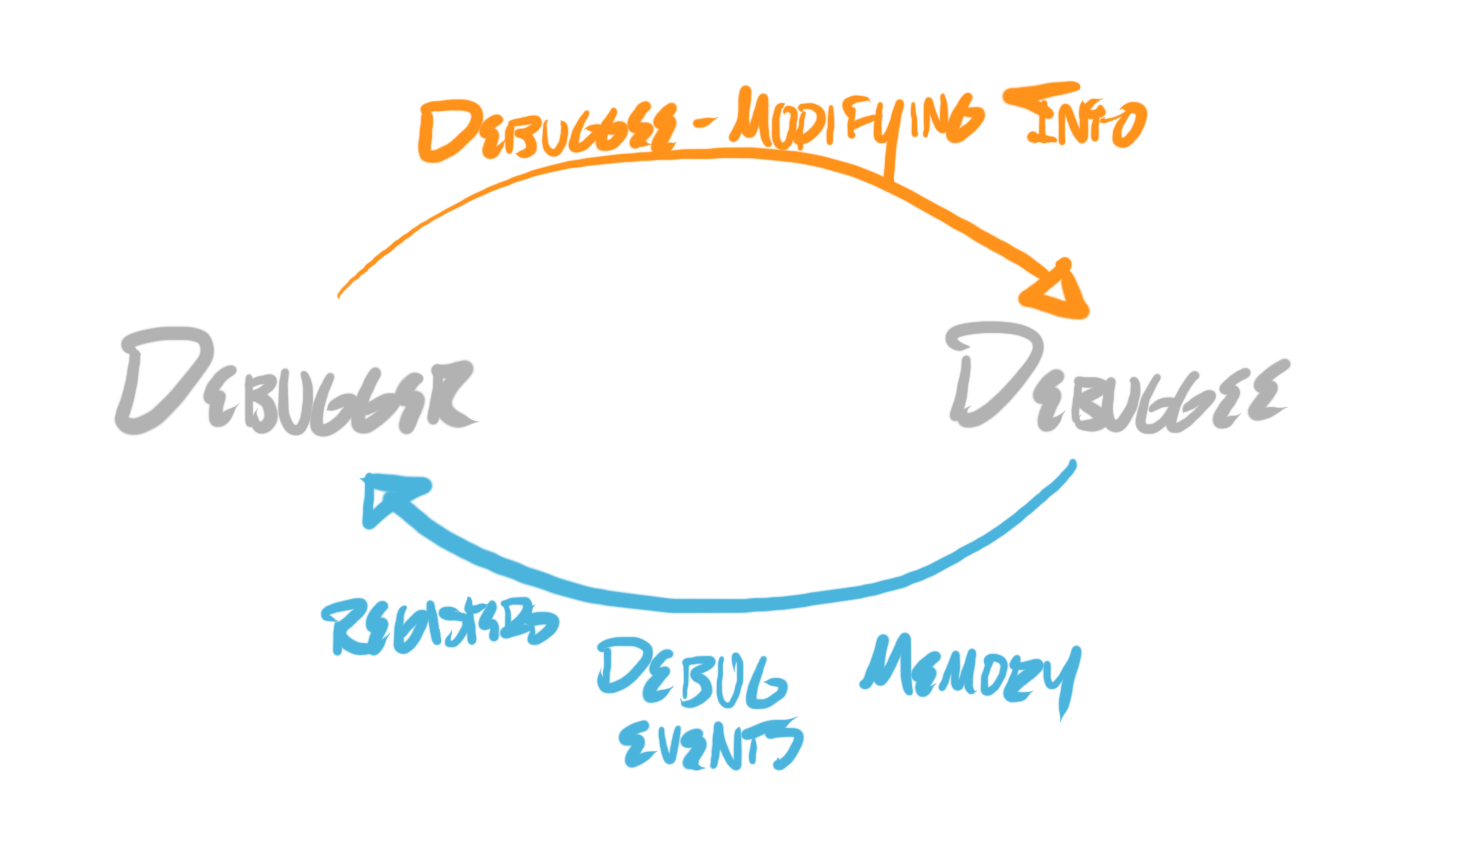
Kernels provide a few extra mechanisms for this. I stated earlier that they support reading memory from debuggees, and reading thread registers from debuggees. They also provide mechanisms for writing memory into debuggees (on Windows, WriteProcessMemory, on Linux, pwrite), and writing thread registers into debuggees (on Windows, SetThreadContext, on Linux, ptrace).
An additional mechanism available to debuggers is the selection of which debuggee threads will be scheduled. This is often exposed through a “thread freezing” feature in debuggers:

In the case of Linux, because ptrace is a thread-granularity API, this is a natural extension of ptrace functionality—the debugger can simply decide to not resume execution of specific threads. On Windows, this functionality is provided through SuspendThread and ResumeThread, which control a per-thread counter. When this counter is nonzero, a thread will not be scheduled. When it is zero, the thread is legal to be scheduled by the kernel.
The kernel just providing the ability to write memory, write registers, and suspend or resume threads leads to a massive explosion of potential features, of which debuggers can take advantage. But we’ll dig into exactly how a debugger can take advantage of these features in a later post.
On Current Operating System Debugger APIs
The peculiarities—of which there are many—of the Windows or Linux debugger APIs are not particularly relevant, which is why I am not exhaustively exploring them in these posts. The more important part is the set of operations that they facilitate—the effects which they may be used to create.
I encourage readers to not be too concerned about these peculiarities. For the RAD Debugger, because we’ve built the debugger to be easily portable, and thus did not want to couple our debugger functionality tightly to specific peculiarities of—say—the Windows debugging API, we built our own debugging API abstraction, which is much simpler for us to use in implementing the debugger. This API is implemented as needed on each target platform.
Furthermore, I encourage readers to not be too intimidated by these APIs. There is no magic here—at some level, the following API must be implementable on each platform, in order for debuggers (as we know them) to work at all:
DebugEvent GetNextDebugEvent(...)
U64 ReadProcessMemory(Handle process, U64 addr, void *out, U64 size)
U64 WriteProcessMemory(Handle process, U64 vaddr, void *in, U64 size)
U64 ReadThreadRegs(Handle thread, void *out)
U64 WriteThreadRegs(Handle thread, void *in)
As a concrete example, here are the associated APIs in the RAD Debugger codebase:
DMN_EventList dmn_ctrl_run(Arena *arena, DMN_CtrlCtx *ctx, DMN_RunCtrls *ctrls)
U64 dmn_process_read(DMN_Handle process, Rng1U64 range, void *dst)
B32 dmn_process_write(DMN_Handle process, Rng1U64 range, void *src)
B32 dmn_thread_read_reg_block(DMN_Handle handle, void *reg_block)
B32 dmn_thread_write_reg_block(DMN_Handle handle, void *reg_block)
The details can get a bit messy, but I encourage a spirit of resolve, because there are some amazing possibilities unlocked when the implementation is right!
I’ve now covered all of the basic building blocks that kernels provide for debuggers. As surprising as it may seem, this is all of the machinery we need from the kernel for the vast majority of common debugger features. But we’ll dig more into how a debugger can take advantage of this machinery next time!
If you enjoyed this post, please consider subscribing. Thanks for reading.
-Ryan
Really enjoying this series! You got me to start reading the OSTEP book to dig into some related OS concepts - had it on my list for a while. Thank you for writing it!
Thanks for this series! The posts are really interesting and “easy” to read. One question: with the kernel providing the possibility to read or write another process memory as (apparently) so easily, how does security fit in this scheme?